


Edpuzzle Curriculum 5 years ago

MathontheWeb 9 years ago
In this video, we're going to discuss the function concept and the vertical line test. We'll use this information to determine if the ...

Envato Tuts+ A year ago
What is the difference between a chart and a graph? In this video, we'll answer that question and cover the various types of charts ...

The Organic Chemistry Tutor 7 years ago
This precalculus video tutorial explains how to find the domain and range of a function given its graph in interval notation.

UNDATABLE 3 years ago
In this video I cover different world's five most popular types of graph and when they should be used. For example, a bar chart is ...

Brian McLogan 7 years ago
Learn all about the applications of the derivative. Differentiation allows us to determine the change at a given point. We will use ...

Sarada Herke 9 years ago
In this video we recall the definition of a graph isomorphism and then give the definition of a graph homomorphism. Then we look ...

Eddie Woo 11 years ago

Bicen Maths 2 days ago
Use this as quick revision, to summarise a playlist, and/or to check that you are ready to tackle exam questions. (Remember you ...

Professor Leonard 5 years ago
Support: https://www.patreon.com/ProfessorLeonard Cool Mathy Merch: https://professor-leonard.myshopify.com How to use ...

Mathbyfives 12 years ago
Long over due. This video contains three examples of how to find the domain and range from a graph. Evaluate a Function from a ...
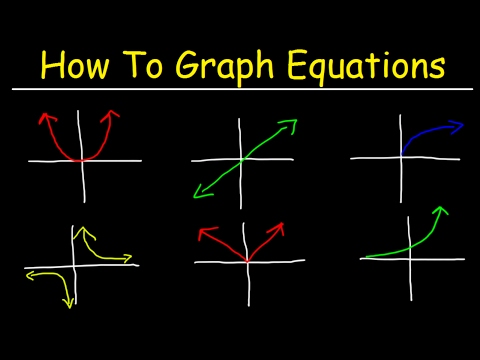
The Organic Chemistry Tutor 9 years ago
This video shows you how to graph almost any equation that you may encounter in Pre-Algebra, Algebra 1, Algebra 2, College ...

Mathbyfives 9 years ago
This is the vid about the to determine whether a function is even, odd, or neither graphically. The video uses reflections. For more ...

UHDCMS 12 years ago
How to determine if a function represented by a graph is a one-to-one function.

TI FI TRICKS 3 years ago
Use earphones for better experience.

Brian McLogan 13 years ago
Learn how to graph a sine function. To graph a sine function, we first determine the amplitude (the maximum point on the graph), ...

Brian McLogan 6 years ago
Learn about the characteristics of a function. Given a function, we can determine the characteristics of the function's graph. We can ...

Brian McLogan 9 years ago
Subscribe! http://www.freemathvideos.com Want more math video lessons? Visit my website to view all of my math videos ...
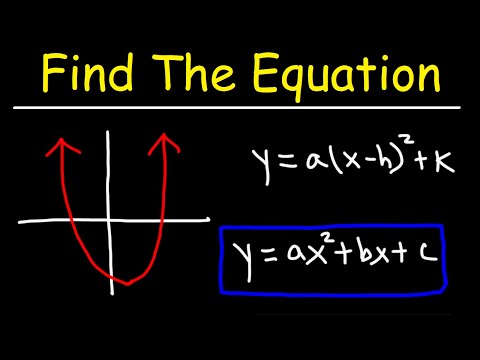
The Organic Chemistry Tutor 2 years ago
This algebra video tutorial explains how to find the equation of a quadratic function from a graph in standard form given 3 points ...
![How to tell the shape of Graph ?[JEE Mains ] | Concave and Convex Graph | Shape of Graph](https://i.ytimg.com/vi/oCF-7PJ5eS0/hqdefault.jpg)
Course Plus 4 years ago
HowToTellTheShapeOfGraph #ShapeOfGraph Title: How to tell the shape of Graph ?[JEE Mains ] | Concave and Convex Graph ...

Mario's Math Tutoring 7 years ago
Is the graph a sine or cosine graph and which function should you use when writing the equation. We discuss sine and cosine ...
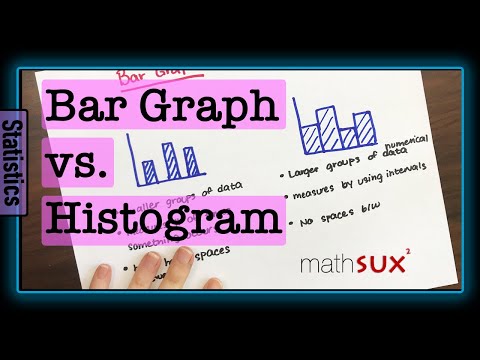
MathSux 4 years ago
Both a bar graph and a histogram allow us to easily visualize a data set that would otherwise just look like a bunch of numbers.

Math and Science 9 years ago
This is just a few minutes of a complete course. Get full lessons & more subjects at: http://www.MathTutorDVD.com. In this lesson ...

The Organic Chemistry Tutor 7 years ago
This calculus video tutorial explains how to evaluate limits from a graph. It explains how to evaluate one sided limits as well as ...

patrickJMT 13 years ago
Finding Local and Absolute Maximum and Minimum from a Graph In this video, we delve into the world of calculus as we explore ...

patrickJMT 14 years ago
Finding Domain and Range of a Function Using a Graph: Step-by-Step Examples In this video, we'll explore how to find the ...

Vedantu JEE Made Ejee A year ago
Drishti (JEE 2026) - https://vdnt.in/Fjr8X 🔴 Manthan (JEE 2025) - https://vdnt.in/Fjr9q ⚡For Batch Admission Inquiry Fill the Form: ...
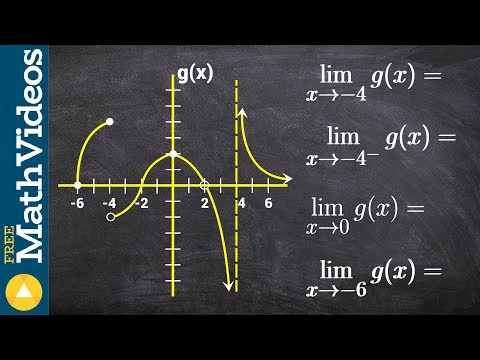
Brian McLogan 6 years ago
Learn how to evaluate the limit of a function from the graph of the function. The limit of a function as the input variable of the ...

Brian McLogan 8 years ago
Learn how to find all the zeros of a factored polynomial. A polynomial is an expression of the form ax^n + bx^(n-1) + . . . + k, where ...
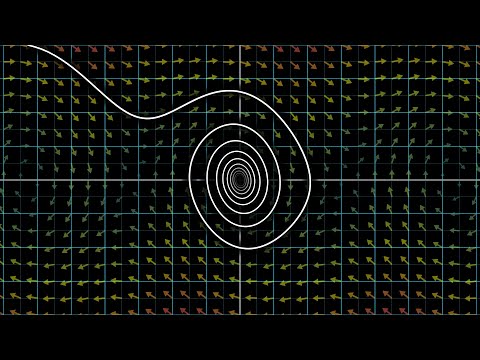
3Blue1Brown 5 years ago
An overview of what ODEs are all about Help fund future projects: https://www.patreon.com/3blue1brown An equally valuable form ...

Mathispower4u 13 years ago
This video explains how to graph an exponential and logarithmic function on the same coordinate plane. The two functions are ...

Professor Leonard 5 years ago
Support: https://www.patreon.com/ProfessorLeonard Cool Mathy Merch: https://professor-leonard.myshopify.com How to graph ...

Sarada Herke 10 years ago
Here we describe the difference between two similar sounding words in mathematics: maximum and maximal. We use concepts in ...
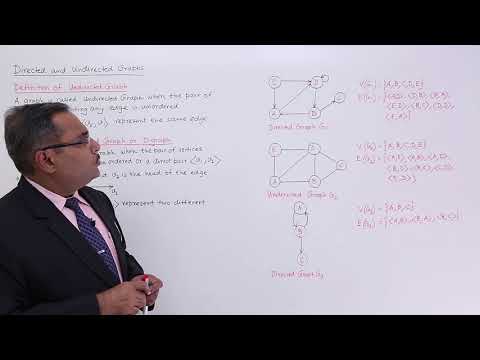
TutorialsPoint 7 years ago
Graph Types Directed and Undirected Graph Watch More Videos at https://www.tutorialspoint.com/videotutorials/index.htm ...
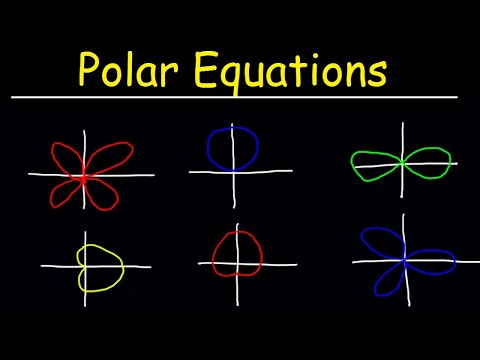
The Organic Chemistry Tutor 3 years ago
The full version of this precalculus video tutorial focuses on graphing polar equations. It explains how to graph circles, limacons, ...

Brian McLogan 8 years ago
Learn how to determine whether relations such as equations, graphs, ordered pairs, mapping and tables represent a function.

The Organic Chemistry Tutor 3 years ago
This trigonometry video tutorial explains how to graph sine and cosine functions using transformations, horizontal shifts / phase ...
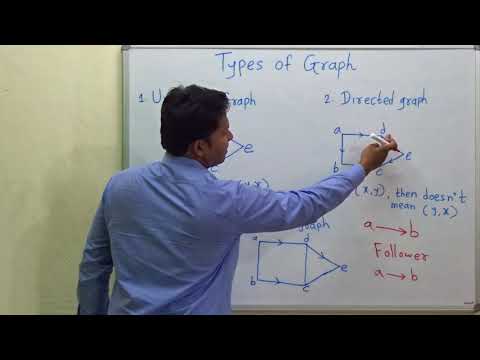
Vivekanand Khyade - Algorithm Every Day 6 years ago
The types of Graph (Undirected , Directed , Mixed ) .

CppNuts 5 years ago
JOIN ME ————— YouTube 🎬 https://www.youtube.com/channel/UCs6sf4iRhhE875T1QjG3wPQ/join Patreon ...
Learn Coding 5 years ago
Difference between Stack and Queue? https://youtu.be/A-6WgqH7bQ4 Please Subscribe our Channel... Learning C and Oops ...

MathMafia 4 years ago
This video goes through a few examples of determining if a function is linear or nonlinear from a graph or a set of points.

graderocketbeta 14 years ago
http://WWW.GRADEROCKET.TV - FREE CALCULUS TUTORIALS FOR THE PLANET. Sign up for our beta! Extra explanation can ...

24 minute lessons A year ago
Basis in graphs #graphsketching #graphs Join this channel to get access to perks: ...

Brian McLogan 7 years ago
Learn how to determine the extrema, the intervals of increasing/decreasing, and the concavity of a function from its graph.

Miss Martins Maths and Science 2 months ago
Trig graphs gr 10 maths - the sine graph! In this video I go over the basic sin graph, what it looks like, how to draw it and ...
Math with Sohn 2 years ago
Given a graph find how many real or complex zeros by looking at the x-intercepts of a polynomial function.

Mathispower4u 2 years ago
shorts This video explains how to graph a piecewise defined function.

Mashup Math 9 years ago
Join us on this flipped math lesson where we visually explore how to graph a linear function in slope intercept form also know as ...

Mathispower4u 11 years ago
This video provides an example of how to find the interval where a function is increasing or decreasing, and concave up or ...

MooMooMath and Science 4 years ago
Learn which type of graph is best four your data. A line graph is helpful for data over time, and a bar graph is helpful for categories.