


The Organic Chemistry Tutor 7 years ago
This calculus video tutorial explains how to evaluate limits from a graph. It explains how to evaluate one sided limits as well as ...
![[Algorithms] Negative weight edges and negative weight cycle in a directed graph](https://i.ytimg.com/vi/0HXYTi6ZG5Q/hqdefault.jpg)
Badri Adhikari 4 years ago
Brian McLogan 6 years ago
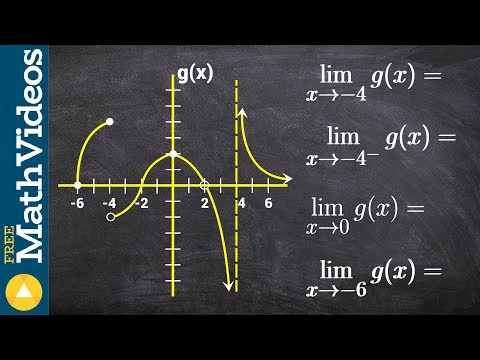
Learn how to evaluate the limit of a function from the graph of the function. The limit of a function as the input variable of the ...

WilliamFiset 7 years ago
Bellman Ford algorithm explanation video on how to find the shortest path and handle negative cycles. Github source code link: ...

Learnalgebra Org 7 years ago

onmaths 7 years ago
Topic: Straight-Line Graphs: Find Gradient From Graph (m = Positive) Do this paper online for free: ...

Statistics Bio7 3 years ago
In this video tutorial, I will show you how to make a Positive Negative Bar Graph by using the Origin Pro 2021 version.
Davitily 16 years ago
http://www.mathproblemgenerator.com - How to, Given a Graph, Find the Slope. . For more practice and to create math ...

Atom's Adventure Stories 3 days ago
Join Atom in this exciting video where we dive into the world of graphs to learn how to easily convert a distance-time (d-t) graph to ...

Bruce Konners 5 years ago
How to move the X-Axis from the middle of the graph (chart) in Excel to the bottom of the graph (chart). Also explains how to ...

Maths with Jay 5 years ago
How to draw line graphs and shade required region for 3 linear inequalities. (Linear Programming)
Mrs. Kender 9 years ago
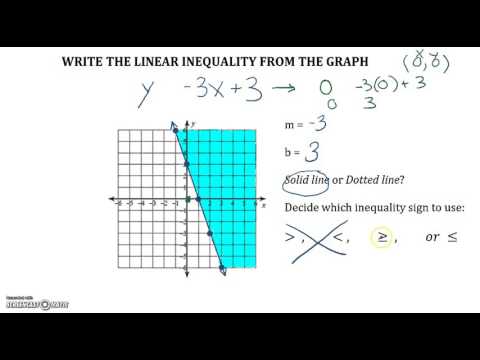
Grab a pencil and paper and study along with me! In this video, you will be given the graph of a linear inequality and write the ...


Techdose 5 years ago
This video shows a very elegant and easy method to detect if a directed graph contains cycle or not. This is a basic graph problem ...

Brian McLogan 3 years ago
when you need to find the limit of a graph you will want to find the y-value that the graph is approaching from the left and from the ...

A Level Physics HQ 4 years ago
Got some data to plot on a graph and need to plot it onto a graph grid? What scale are you going to choose for your axes? In this ...

Mathispower4u 13 years ago
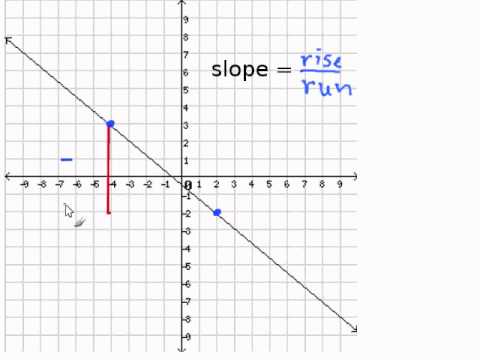
This video explains how to determine the slope of a line given the graph of a line with a negative slope. Complete Video Library at ...
Brian McLogan 9 years ago
Learn how to find the degree and the leading coefficient of a polynomial expression. The degree of a polynomial expression is the ...

Brian McLogan 9 years ago
Learn how to graph quadratic equations by completeing the square. A quadratic equation is an equation of the form y = ax^2 + bx ...

Mr. S Math 6 years ago
In this example problem, I explain the process of finding one and two sided limits when you are given a graph. If you have any ...

Brian McLogan 10 years ago
Learn how to graph linear equations written in slope intercept form. When given a linear equation in slope intercept form, (i.e. in ...

Laura Smith 4 years ago
This video will demonstrate how to plot a line graph with two separate vertical y-axis. This is on version Microsoft Excel 365.

Brian McLogan 6 years ago
I make short, to-the-point online math tutorials. I struggled with math growing up and have been able to use those experiences to ...

The Organic Chemistry Tutor A year ago
This physics video tutorial explains how to calculate displacement from a velocity-time graph. Physics - Basic Introduction: ...

Math with Sohn 2 years ago
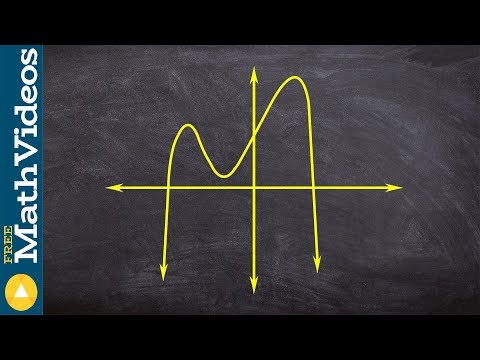
Find the End Behavior from a graph.

Brian McLogan 7 years ago
Learn how to sketch angles in terms of pi. An angle is the figure formed by two rays sharing the same endpoint. Angle is measured ...

Brian McLogan 2 years ago
In this video I will go over the reason of why is b the y-intercept of the graph. SUBSCRIBE to my channel here: ...

Dardev 4 years ago
You are given a directed graph, and your task is to find out if it contains a negative cycle, and also give an example of such a cycle ...

Physics Online 6 years ago
This is another worked example of plotting data on a graph. This is a popular type of question for students to be asked and this ...

Mario's Math Tutoring 5 years ago
Learn how to find limits given a graph in this video math tutorial by Mario's Math Tutoring. We go through 11 examples involving ...

Mathispower4u 3 years ago
This video explains how to determine limits, if they exist, from a graph.

onmaths 7 years ago
Topic: Straight-Line Graphs: Find Gradient From Graph (m = Negative) Do this paper online for free: ...
![Distance Time Graph [Explained with 3D Animated Video] | Alyss](https://i.ytimg.com/vi/tSnT_UjKvyE/hqdefault.jpg)
Alyss Edusolutions 2 years ago
This video explains distance-time graph using a 3D animation. This topic is taught in Class 7, Class 9, and Class 11.

Mr Ruel Tuition A year ago
This is a video on how to sketch a graph if you have a Quadratic Function. Does this make it easy for you? Maths Made EASY ...

BSuperior System Ltd. 4 years ago
Extrapolating a graph by trendline helps you represent visual data trends. Here we're going to learn, how to add a trendline to our ...

larryschmidt 7 years ago
How to find values and intervals where the graph of a function is zero, negative, or positive.

Brian McLogan 10 years ago
Learn how to graph a system of inequalities. A system of inequalities is a set of inequalities which are collectively satisfied by a ...

The Complete Guide to Everything 4 years ago
In this tutorial I will show you how to switch the X and Y axis in an excel graph. I will show you step by step all of the things you ...

The Organic Chemistry Tutor A year ago
This physics video tutorial explains how to find the acceleration from a velocity-time graph. The acceleration is positive whenever ...

Bozeman Science 14 years ago
Mr. Andersen shows you how to read a position vs. time graph to determine the velocity of an object. Objects that are accelerating ...

Brian McLogan 7 years ago
Learn all about the applications of the derivative. Differentiation allows us to determine the change at a given point. We will use ...

Study Gaze 3 years ago
In this video, we will learn how to plot double y axis curve in OriginPro software. This video is very helpful for research paper ...

Cognito 4 years ago
This video covers how to solve multiple inequalities by plotting them all on a graph and finding the area that satisfies all them (the ...

Math and Science 6 years ago
Get more lessons like this at http://www.MathTutorDVD.com. In this lesson, you will learn how to solve inequalities that have two ...

Mr S 2 years ago

Tableau 5 years ago
In this silent video, you'll learn how to create a graph that combines a bar chart with two or more lines in Tableau. Read the full ...

Seetha Maths Tuition Centre 🎓 3 years ago
seethamathstuitioncentre How to plot the points in a Graph in simple method.

Brian McLogan A year ago
In this video we are going to explore how to graph a sideways parabola by identifying the parts such as the vertex, focus and ...

Bozeman Science 14 years ago
Mr. Andersen shows you how to interpret a position vs. time graph for an object with constant velocity. The slope of the line is used ...

Mashup Math 9 years ago
Join us on this flipped math lesson where we visually explore how to graph a linear function in slope intercept form also know as ...